
- Production of Crude Oil
Crude oil production during March, 2021 was 2612.96 TMT which is 5.63% lower than target and 3.13% lower when compared with March, 2020.Cumulative crude oil production during April-March, 2020-21 was 30491.77 TMT which is 5.65% and 5.22% lower than target for the period and production during corresponding period of last year respectively. Unit-wise and State-wise crude oil production is given at Annexure-I. Unit-wise crude oil production for the month of March, 2021 and cumulatively for the period April-March, 2020-21vis-à-vis same period of last year has been shown in Table-1 and month-wise in Figure-1.
Table-1: Crude Oil Production (in TMT)
|
Oil Company |
Target |
March (Month) |
April-March (Cumulative) |
||||||
|
2020-21 (Apr-Mar) |
2020-21 |
2019-20 |
% over last year |
2020-21 |
2019-20 |
% over last year |
|||
|
Target |
Prod.* |
Prod. |
Target |
Prod.* |
Prod. |
||||
|
ONGC |
20931.68 |
1768.12 |
1713.08 |
1778.11 |
96.34 |
20931.68 |
20182.75 |
20626.95 |
97.85 |
|
OIL |
3121.00 |
272.49 |
249.61 |
254.07 |
98.25 |
3121.00 |
2937.37 |
3106.61 |
94.55 |
|
PSC Fields |
8265.00 |
728.15 |
650.26 |
665.28 |
97.74 |
8265.00 |
7371.65 |
8436.19 |
87.38 |
|
Total |
32317.68 |
2768.76 |
2612.96 |
2697.45 |
96.87 |
32317.68 |
30491.77 |
32169.76 |
94.78 |
Note: Totals may not tally due to rounding off.*: Provisional
Figure-1: Monthly Crude Oil Production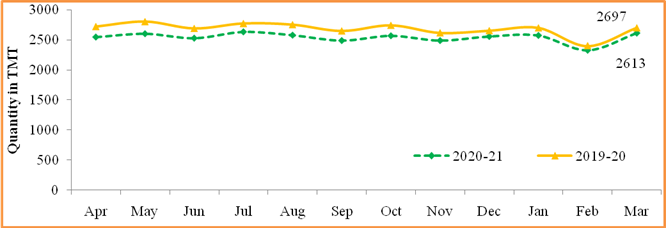
Unit-wise production details with reasons for shortfall are as under:
-
- Crude oil production by ONGC(Oil and Natural Gas Corporation) in nomination block during March, 2021 was 1713.08 TMT which is 3.11%lower than target and 3.66%lower when compared with March 2020. Cumulative crude oil production by ONGC during April-March, 2020-21 was 20182.75 TMT which is 3.58%and 2.15% lower than target for the period andproduction during corresponding period of last year respectively. Reasons for shortfall in production are as under:
- Production planned from WO16 cluster from June’20 could not be realized due to delay in MOPU (SagarSamrat) as activities at GPC yard Abu Dhabi got affected due to Covid restrictions/lockdown
- New wells planned under Cluster 8 development project delayed due to delay in installation of new platforms due to COVID implications
-
- Crude oil production by OIL(Oil India Ltd) in the nomination block during March, 2021 was 249.61 TMT which is8.40% lower than target and 1.75% lower when compared with March 2020. Cumulative crude oil production by OIL during April-March, 2020-21 was 2937.37 TMT which is 5.88% and 5.45% lower than target for the period and production during corresponding period of last year respectively. Reasons for shortfall in production are as under:
- Less than planned contribution from workover wells, drilling wells and old wells.
- Bandhs /blockade by local people and associations after the Baghjan Blowout.
-
- Crude oil production by Pvt/JVscompanies in the PSC (Production Sharing Contract) regime during March, 2021 was 650.26 TMT which is 10.70% lower than target and 2.26% lower when compared with March 2020. Cumulative crude oil production by Pvt/JVs companies during April-March, 2021 was 7371.65 TMT which is 10.81% and 12.62% lower than target for the period and production during corresponding period of last year respectively.Reasons for shortfall in production are as under:
- RJ-ON-90/1 (Cairn Energy India Ltd): Delayed start up full field polymer injection in Bhagyam and Aishwarya field. Delay in hook-up of Stage-2 wells and NA-1 processing facility commissioning in advance stage in ABH. Flow cease in few wells of Satellite fields. Project schedule of Well and Surface Facility of Tukaram, Kaam-1 and GSV Condensate is impacted by COVID-19.
- B-80 (Hindustan Oil Exploration Company Ltd): Production from B80 field not commenced due to delay in completion of field development activities because of COVID.
- RAVVA (Cairn Energy India Ltd): Decline in production from producer wells.
- PY-3 (HARDY): Production could not be commenced in PY-3 field due to intra-JV issues.
- CB-ONN-2005/9 (MERCATOR): Block under PI transfer request and National Company Law Tribunal proceedings.
- Production of Natural Gas
Natural Gas production during March,2021 was 2683.90 MMSCM which is 11.11% higher when compared with March, 2020 but 15.11% lower than the monthly target. Cumulative natural gas production during April-March, 2020-21 was 28670.60 MMSCM which is 14.60% and 8.06% lower than target for the period and production during corresponding period of last year respectively. Unit-wise and state-wise natural gas production is given at Annexure-II. Unit-wise natural gas production for the month of March, 2021 and cumulatively for the period April-March, 2020-21vis-à-vis same period of last year has been shown in Table-2 and month-wise in Figure-2.
Table-2: Natural Gas Production (inMMSCM)
|
Oil Company |
Target |
March (Month) |
April-March (Cumulative) |
||||||
|
2020-21 (Apr-Mar) |
2020-21 |
2019-20 |
% over last year |
2020-21 |
2019-20 |
% over last year |
|||
|
Target |
Prod.* |
Prod. |
Target |
Prod.* |
Prod. |
||||
|
ONGC |
23982.98 |
2049.98 |
1831.74 |
1905.52 |
96.13 |
23982.98 |
21871.94 |
23746.19 |
92.11 |
|
OIL |
2761.73 |
261.47 |
210.09 |
211.62 |
99.28 |
2761.73 |
2479.73 |
2668.25 |
92.93 |
|
PSC Fields |
6826.82 |
850.27 |
642.07 |
298.29 |
215.25 |
6826.82 |
4318.93 |
4769.78 |
90.55 |
|
Total |
33571.53 |
3161.72 |
2683.90 |
2415.43 |
111.11 |
33571.53 |
28670.60 |
31184.22 |
91.94 |
Note: Totals may not tally due to rounding off. *: Provisional
Figure-2: Monthly Natural Gas Production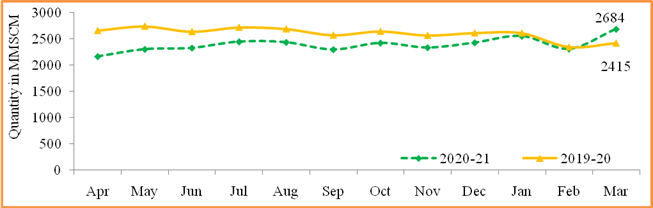
-
- Natural gas production by ONGC in the nomination blocks during March, 2021 was 1831.74 MMSCM which is 10.65% lower than target and 3.87%lower when compared with March 2020. Cumulative natural gas production by ONGC during April-March, 2020-21 was 21871.94 MMSCM which is 8.80% and 7.89% lower than target for the period and production during corresponding period of last year respectively.Reasons for shortfall in production are as under:
- Less Gas production from WO16 cluster due to delay in mobilization of MOPU (SagarSamrat)
- Less than planned production from Vasistha/S1 wells in EOA due certain reservoir related issues/high liquid.
- Less than envisaged production from Daman-Tapti Block.
- Less gas intake by Uran Plant due to maintenance job.
-
- Natural gas production by OILin the nomination block during March, 2021 was 210.09 MMSCM which is 19.65% lower than monthly target and 0.72% lower than the March, 2020. Cumulative natural gas production by OIL during April-March, 2020-21 was 2479.73 MMSCM which is 10.21% and 7.07% lower than target for the period and production during corresponding period of last year respectively. Reasons for shortfall in production are as under:
- Low upliftment/demand of gas by the major customers.
- Bandhs /blockade by local people and associations after the Baghjan Blowout.
-
- Natural gas production by Pvt/JVs companies in the PSC (production sharing contracts) regime during March,2021 was 642.07 MMSCM which is 115.25% higher than the March, 2020 due to new field D-34 (KG 98/3) started production in Dec-2020 with 1.3 MMSCMD, ramped up to 9.6 MMSCMD in March-2021 but total production by Pvt/JVs companies during March, 2021 is 24.49% lower than monthly target. Cumulative natural gas production by Pvt/JVs during April-March, 2020-21 was 4318.93 MMSCM which is 36.74% and 9.45% lower than target for the period and production during corresponding period of last year respectively. Reasons for shortfall in production are as under:
- KG-DWN-98/2 (Oil & Natural Gas Corpn.): U3-B well is flowing less than the expected profile and delay in commissioning of Wells of U1-field.
- KG-DWN-98/3 (Reliance Industries Ltd): As production commencement from R-Cluster (D34) field of KG-DWN-98/3 was delayed due to COVID from June 2020 to December 2020 which hampered the gradual ramp-up of Gas production.
- RJ-ON/6 (Focus Energy Limited): Reduced Gas offtake by buyer.
- Raniganj East (Essar Oil and Gas Exploration & Production Ltd): Production is lower due to less sales off-take.
- KG-OSN-2001/3 (Oil & Natural Gas Corpn.): Well D7 is planned to be safely abandoned.
- Crude Oil Processed (Crude Throughput)
Crude Oil Processed during March, 2021 was 20985.28 TMT which is 2.90% lower than the target for the month and 1.03% lower than March, 2020.Cumulative crude throughput during April-March, 2020-21 was 221773.19 TMT which is 11.88% and 12.82% lower than target for the period and crude throughput during corresponding period of last year respectively. Refinery-wise details of the crude throughput and capacity utilization during the month of March, 2021 vis-à-vis March, 2020 are given at Annexure-III and IV. Company-wise crude throughput for the month of March, 2021 and cumulatively for the period April-March, 2020-21vis-à-vis same period of last year has been shown in Table-3 and month-wise in Figure-3.
Table 3: Crude Oil Processed (Crude Throughput) (in TMT)
|
Oil Company |
Target |
March (Month) |
April-March (Cumulative) |
||||||
|
2020-21 (Apr-Mar) |
2020-21 |
2019-20 |
% over last year |
2020-21 |
2019-20 |
% over last year |
|||
|
Target |
Prod.* |
Prod. |
Target |
Prod.* |
Prod. |
||||
|
CPSE |
147377.43 |
12940.56 |
12841.38 |
12261.68 |
104.73 |
147377.44 |
127503.48 |
144715.80 |
88.11 |
|
IOCL |
72400.04 |
6553.62 |
5926.90 |
5736.13 |
103.33 |
72400.04 |
62350.64 |
69419.36 |
89.82 |
|
BPCL |
33000.00 |
2851.00 |
2759.80 |
2706.52 |
101.97 |
33000.00 |
26222.38 |
31532.11 |
83.16 |
|
HPCL |
16999.28 |
942.06 |
1581.12 |
1514.89 |
104.37 |
16999.28 |
16424.68 |
17180.32 |
95.60 |
|
CPCL |
10290.00 |
920.00 |
963.54 |
853.19 |
112.93 |
10290.00 |
8242.89 |
10160.64 |
81.13 |
|
NRL |
2549.86 |
218.27 |
240.90 |
247.65 |
97.28 |
2549.86 |
2707.35 |
2383.34 |
113.59 |
|
MRPL |
12074.42 |
1450.00 |
1361.39 |
1196.68 |
113.76 |
12074.42 |
11474.55 |
13953.11 |
82.24 |
|
ONGC |
63.83 |
5.61 |
7.72 |
6.63 |
116.39 |
63.83 |
80.99 |
86.93 |
93.17 |
|
JVs |
14772.00 |
1428.00 |
1627.18 |
1698.07 |
95.83 |
14772.00 |
16261.63 |
20154.97 |
80.68 |
|
BORL |
7800.00 |
660.00 |
602.13 |
733.21 |
82.12 |
7800.00 |
6189.63 |
7912.91 |
78.22 |
|
HMEL |
6972.00 |
768.00 |
1025.05 |
964.86 |
106.24 |
6972.00 |
10072.00 |
12242.06 |
82.27 |
|
Private |
89515.16 |
7243.95 |
6516.72 |
7243.95 |
89.96 |
89515.16 |
78008.07 |
89515.16 |
87.15 |
|
RIL |
68894.99 |
5524.94 |
4889.94 |
5524.94 |
88.51 |
68894.99 |
60940.96 |
68894.99 |
88.45 |
|
NEL |
20620.18 |
1719.01 |
1626.78 |
1719.01 |
94.63 |
20620.18 |
17067.11 |
20620.18 |
82.77 |
|
TOTAL |
251664.61 |
21612.51 |
20985.28 |
21203.70 |
98.97 |
251664.61 |
221773.19 |
254385.94 |
87.18 |
Note: Totals may not tally due to rounding off.*: Provisional
Figure 3: Crude Oil Processed (Crude Throughput) 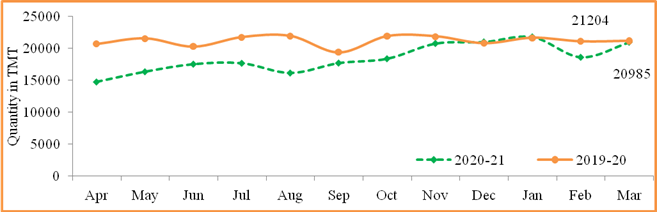
3.1 CPSE Refineries’ crude oil processed during March, 2021 was 12841.38 TMT which is 4.73% higher than the target for the month but 0.77% lower when compared with March, 2020.Cumulative crude throughput by CPSE refineries during April-March, 2020-21 was 127503.48 TMT which is 13.49% and 11.89% lower than target for the period and crude throughput during corresponding period of last year respectively.Reasons for shortfall in production are as under:
- IOCL-Barauni: Crude processed as per product upliftment
- IOCL-Gujarat: Atmospheric Vacuum Unit (AVU-3) maintenance and installation shutdown, High Gas Oils (SRGO/RCO) stock and delayed commissioning of new Diesel Hydrotreating (DHDT)
- IOCL-Haldia: Crude processing regulated due to Hydrogen Generation Unit (HGU-2) interruption.
- IOCL-Digboi: Crude processed lower due maintenance and installation shutdown.
- IOCL-Panipat: Crude processed lower in line with product upliftment and old DHDT shutdown for Packinox tube bundle replacement.
- IOCL-Bongaigaon: Crude processed as per crude availability.
- NRL-Numaligarhi: Crude processed as per crude availability.
3.2 JV refineries’ crude oil processed during March, 2021 was 1627.18 TMT which is 13.95% higher than the target for the month but4.17% lower when compared with March, 2020. Cumulative crude throughput during April-March, 2020-21 was 16261.63 TMT which is 10.08% higher than target for the period but 19.32% lower when compare with the corresponding period of last year respectively.
3.3 Private refineries’ crude oil processed during March, 2021 was 6516.72 TMT which is 10.04% lower than the corresponding month of last year. Cumulative crude throughput during April-March, 2020-21 was 78008.07 TMT which is 12.85% lower than the corresponding period of last year.
- Production of Petroleum Products
Production of Petroleum Products during March, 2021 was 22753.18 TMT which is marginally higher by 0.01% than the target for the month but0.66% lower when compared with March, 2020. Cumulative production during April-March, 2020-21 was 233436.22 TMT which is 9.88% and 11.22% lower than target for the period and production during corresponding period of last year respectively. Unit-wise production of petroleum products is given at Annexure-V. Company-wise production for the month of March, 2021 and cumulatively for the period April-March, 2020-21 vis-à-Vis same period of last year has been shown in Table-4 and month-wise in Figure-4.
Figure 4: Monthly Refinery Production of Petroleum Products
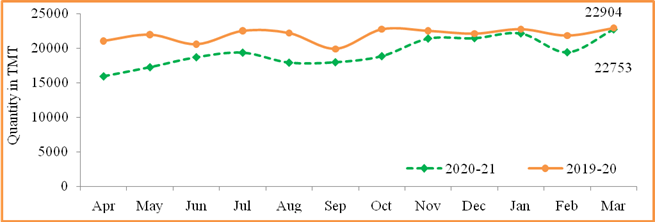
Table 4: Production of Petroleum Products (TMT)
|
Oil Company |
Target |
March (Month) |
April-March (Cumulative) |
||||||
|
2020-21 (Apr-Mar) |
2020-21 |
2019-20 |
% over last year |
2020-21 |
2019-20 |
% over last year |
|||
|
Target |
Prod.* |
Prod. |
Target |
Prod.* |
Prod. |
||||
|
CPSE |
138753.95 |
12154.07 |
12331.02 |
11951.00 |
103.18 |
138753.95 |
120927.70 |
137206.47 |
88.14 |
|
IOCL |
68760.50 |
6239.85 |
5741.84 |
5727.55 |
100.25 |
68760.50 |
59924.81 |
66668.28 |
89.89 |
|
BPCL |
31319.00 |
2686.00 |
2742.32 |
2700.45 |
101.55 |
31319.00 |
25124.09 |
30240.10 |
83.08 |
|
HPCL |
15914.53 |
869.12 |
1463.43 |
1368.70 |
106.92 |
15914.53 |
15360.45 |
15936.81 |
96.38 |
|
CPCL |
9527.02 |
855.28 |
903.64 |
795.74 |
113.56 |
9527.02 |
7576.37 |
9329.77 |
81.21 |
|
NRL |
2554.46 |
222.10 |
250.86 |
249.49 |
100.55 |
2554.46 |
2740.85 |
2299.89 |
119.17 |
|
MRPL |
10618.44 |
1276.45 |
1221.86 |
1102.88 |
110.79 |
10618.44 |
10124.25 |
12651.47 |
80.02 |
|
ONGC |
60.00 |
5.27 |
7.07 |
6.20 |
114.10 |
60.00 |
76.89 |
80.15 |
95.94 |
|
JVs |
13590.40 |
1318.48 |
1511.15 |
1611.07 |
93.80 |
13590.40 |
15073.37 |
18819.89 |
80.09 |
|
BORL |
6958.40 |
588.48 |
546.63 |
658.19 |
83.05 |
6958.40 |
5456.11 |
7218.74 |
75.58 |
|
HMEL |
6632.00 |
730.00 |
964.51 |
952.88 |
101.22 |
6632.00 |
9617.26 |
11601.15 |
82.90 |
|
Private |
102154.50 |
8949.50 |
8553.43 |
8949.50 |
95.57 |
102154.50 |
93222.97 |
102154.50 |
91.26 |
|
RIL |
82374.12 |
7302.54 |
6980.51 |
7302.54 |
95.59 |
82374.12 |
76683.16 |
82374.12 |
93.09 |
|
NEL |
19780.38 |
1646.96 |
1572.92 |
1646.96 |
95.50 |
19780.38 |
16539.81 |
19780.38 |
83.62 |
|
Total Refinery |
254498.86 |
22422.04 |
22395.60 |
22511.57 |
99.48 |
254498.85 |
229224.04 |
258180.85 |
88.78 |
|
Fractionators |
4523.28 |
329.33 |
357.59 |
392.74 |
91.05 |
4523.28 |
4212.18 |
4762.70 |
88.44 |
|
TOTAL |
259022.13 |
22751.37 |
22753.18 |
22904.31 |
99.34 |
259022.13 |
233436.22 |
262943.55 |
88.78 |
Note: Totals may not tally due to rounding off. *: Provisional
-
- Production of petroleum Products by Oil’s Refineries during March, 2021 was 22395.60 TMT which is 0.12% lower than the target for the month and 0.52% lower when compared with March, 2020. Cumulative production of petroleum products by refineries during April-March, 2020-21 was 229224.04 TMT which is 9.93% and 11.22% lower than target for the period and production during corresponding period of last year respectively.
-
- Production of petroleum Products by Fractionators during March, 2021 was 357.59 TMT which is 8.58% higher than the target for the month but 8.95% lower when compared with March, 2020. Cumulative production by Fractionators during April-March, 2020-21 was 4212.18 TMT which is 6.88% and 11.56% lower than target for the period and production during corresponding period of last year respectively.
Click here to see annexures
********
YB
(Release ID: 1712947)
Visitor Counter : 16